February 17, 2024
Analytics
I use SQL for querying and managing data, Python for advanced analysis and automation, and Power BI for creating interactive dashboards. These tools work together to turn complex data into actionable insights and drive informed decision-making.
My Analytics toolkit 🛠️


SQL
Data Mangement & Transformation, ETL

Python
Data Science, Scripts

Power BI
Reports & Dashboards


Tableau
Reports & Dashboards


DeepNote
Data Science, Workspace
Dashboards & Reports
I use tools like Looker Studio, Power BI, and SQL, to create dynamic dashboards and comprehensive reports that transform raw data into actionable insights. SQL enables me to query and manipulate data from various sources, ensuring that I have accurate and relevant data sets for analysis. Looker Studio and Power BI then allow me to visualise this data effectively, using interactive charts, graphs, and tables.
These tools help in tracking key performance indicators (KPIs), monitoring business trends, and facilitating data-driven decision-making. By combining SQL's data handling capabilities with the robust visualisation features of Looker Studio and Power BI, I can produce clear, concise, and visually appealing reports that support strategic business planning and operational efficiency.
Below are some examples.
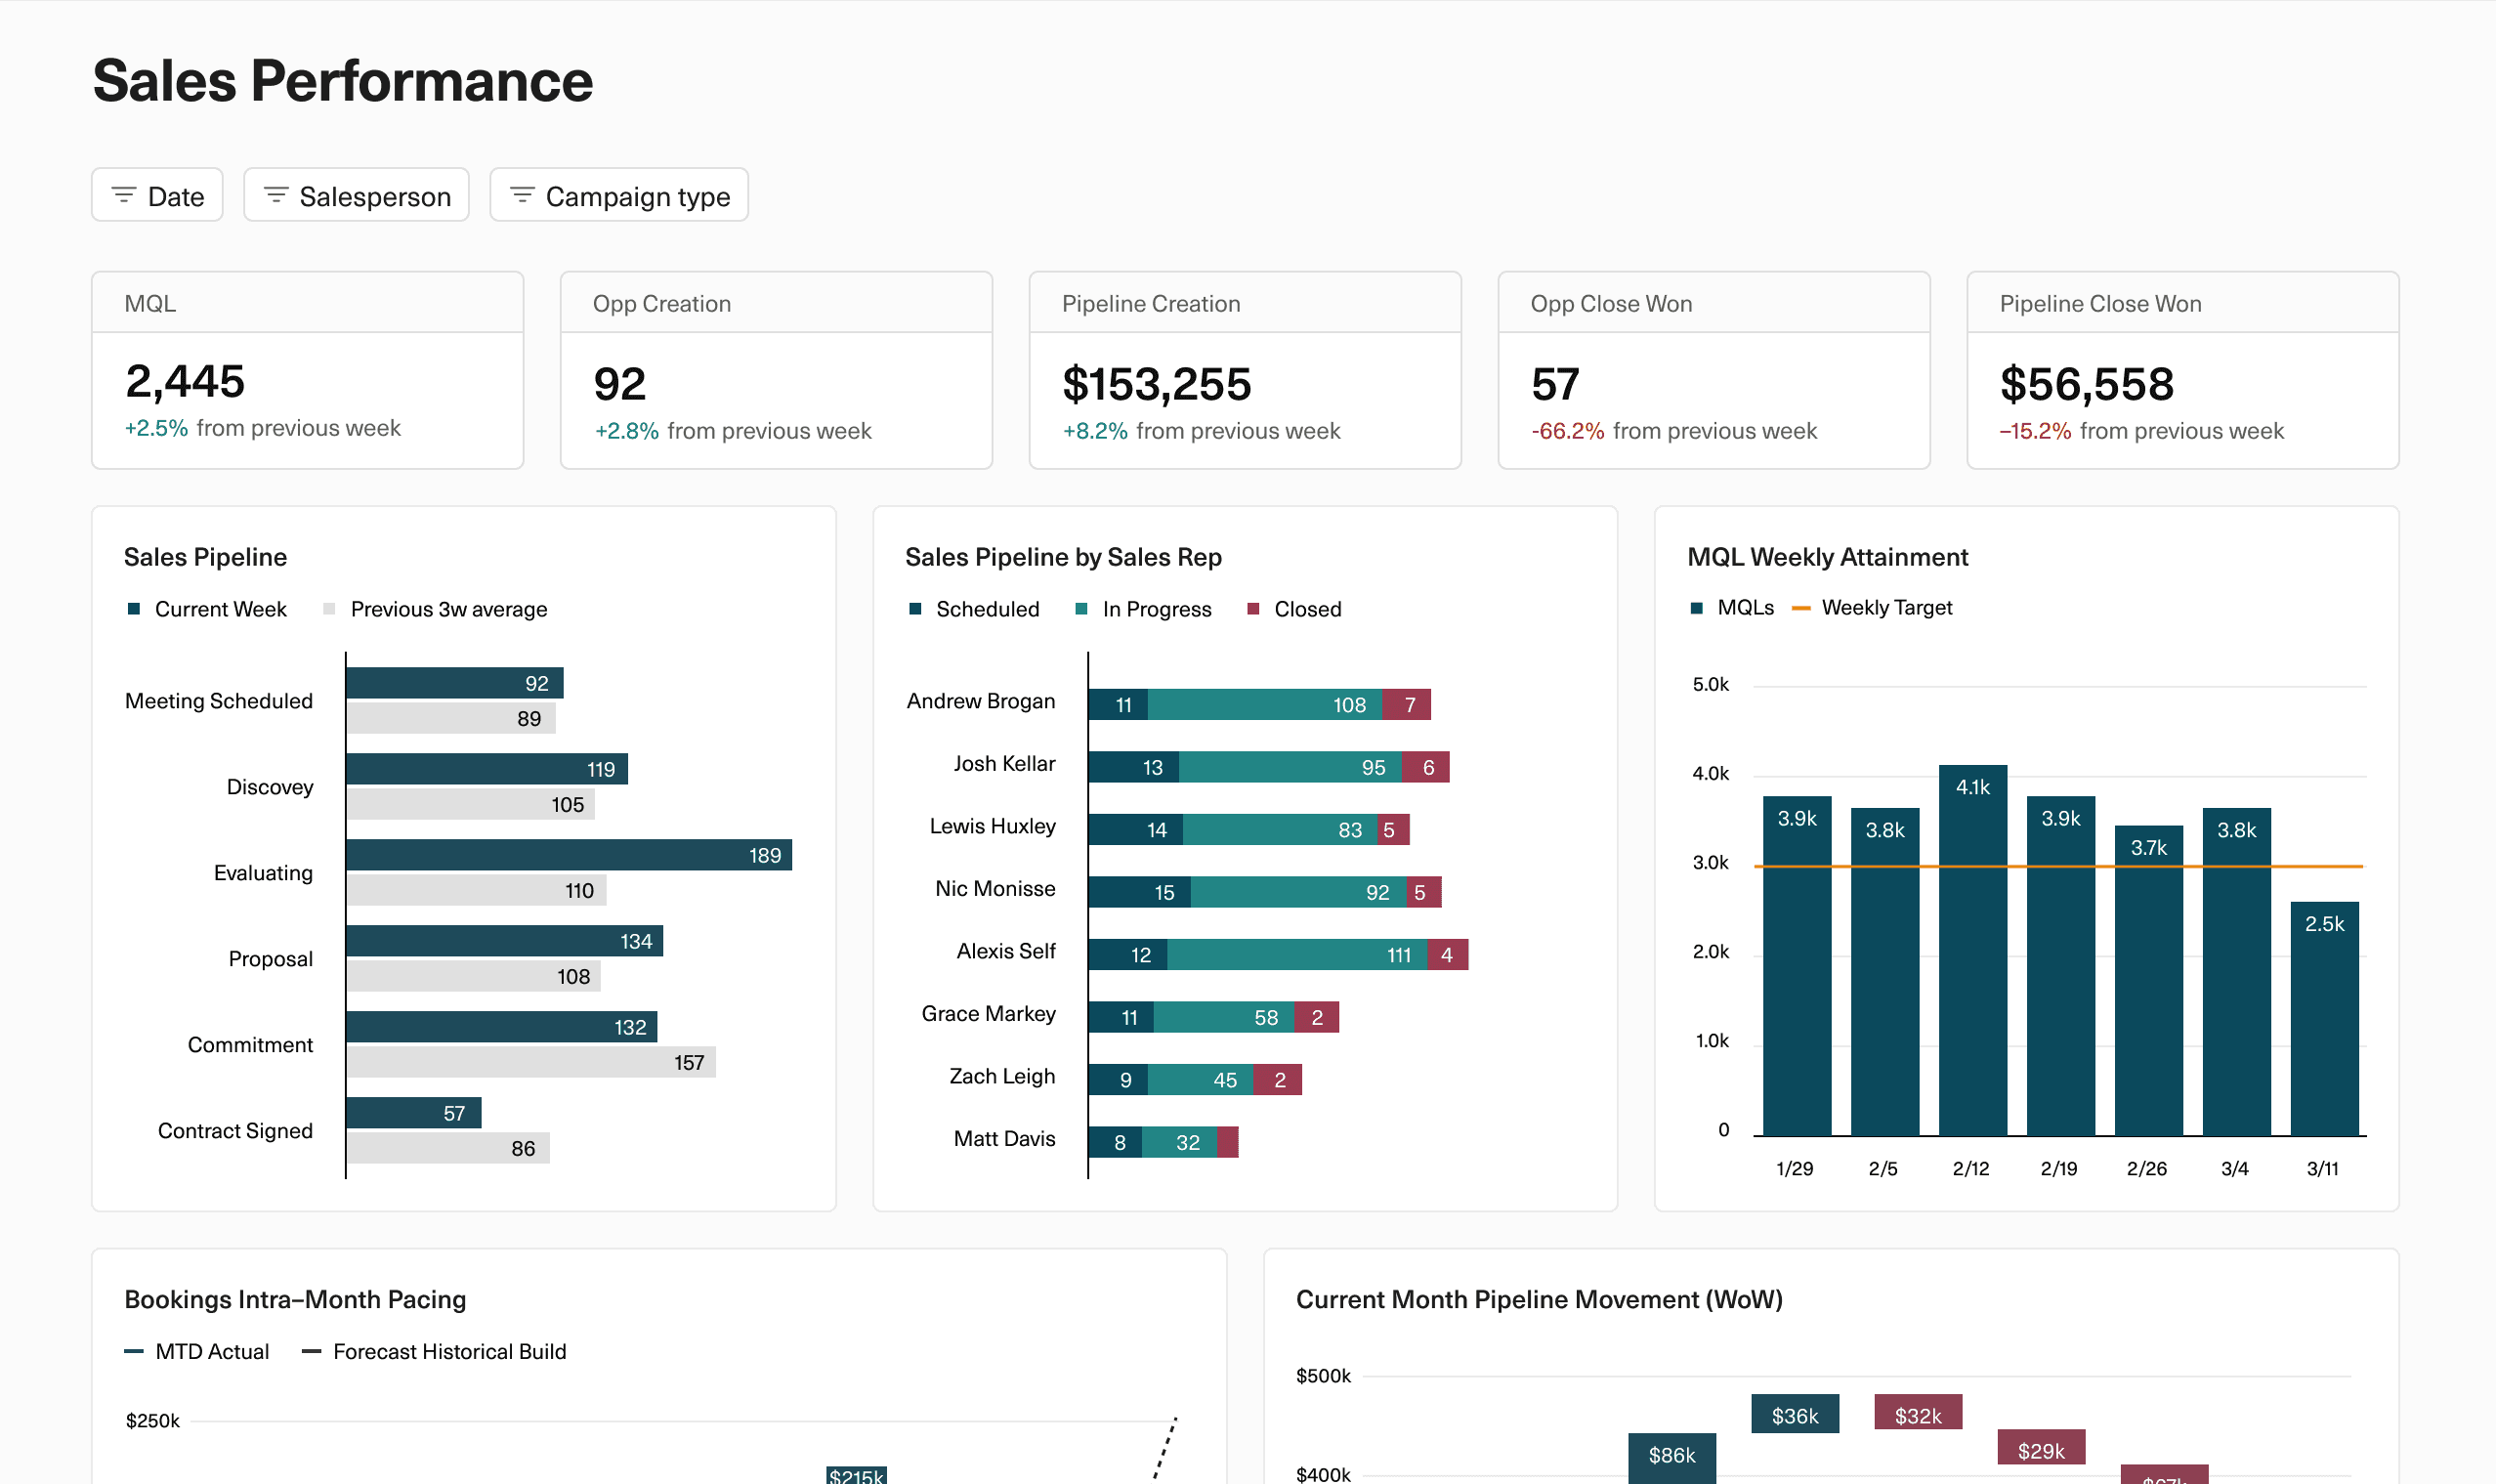
Sales Performance
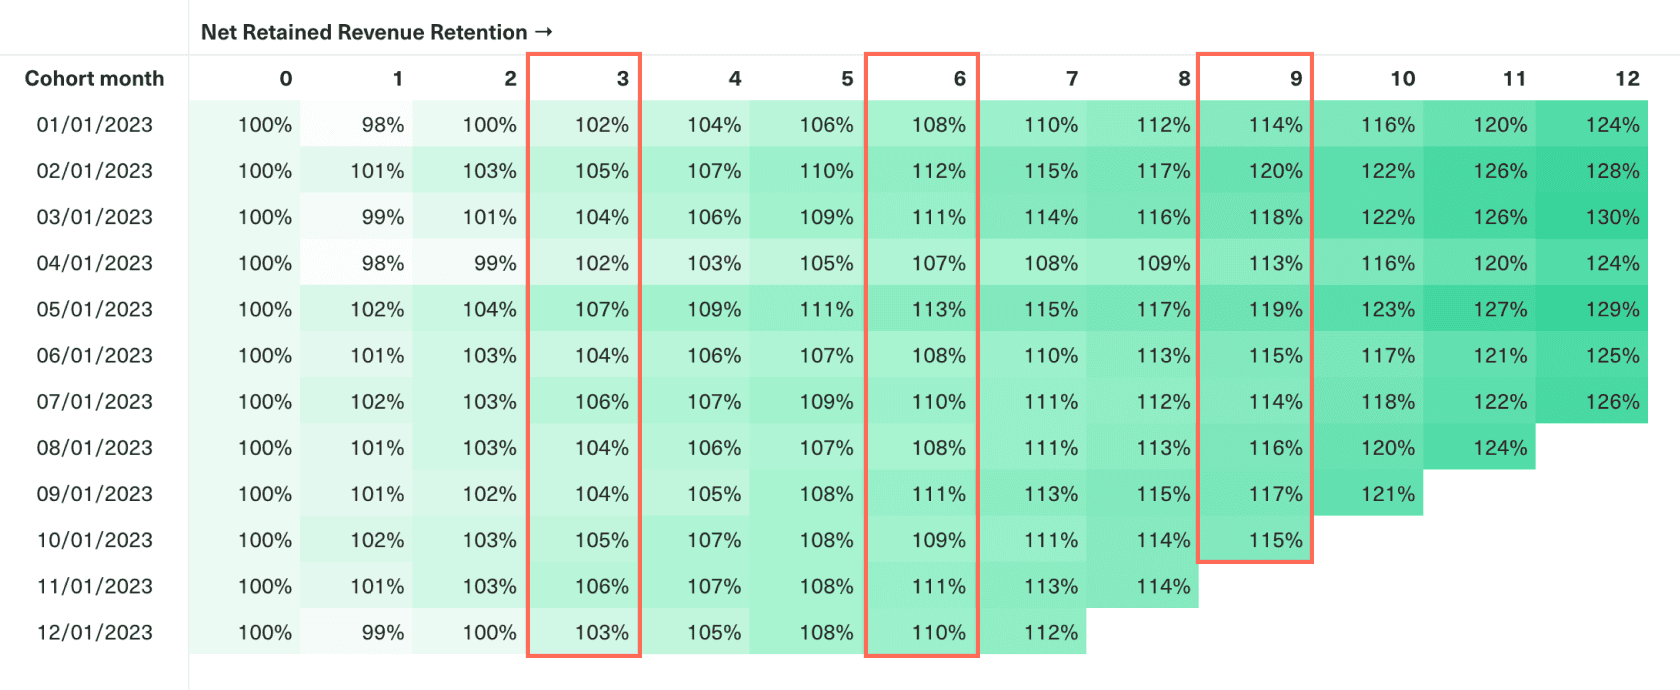
Cohort Analysis
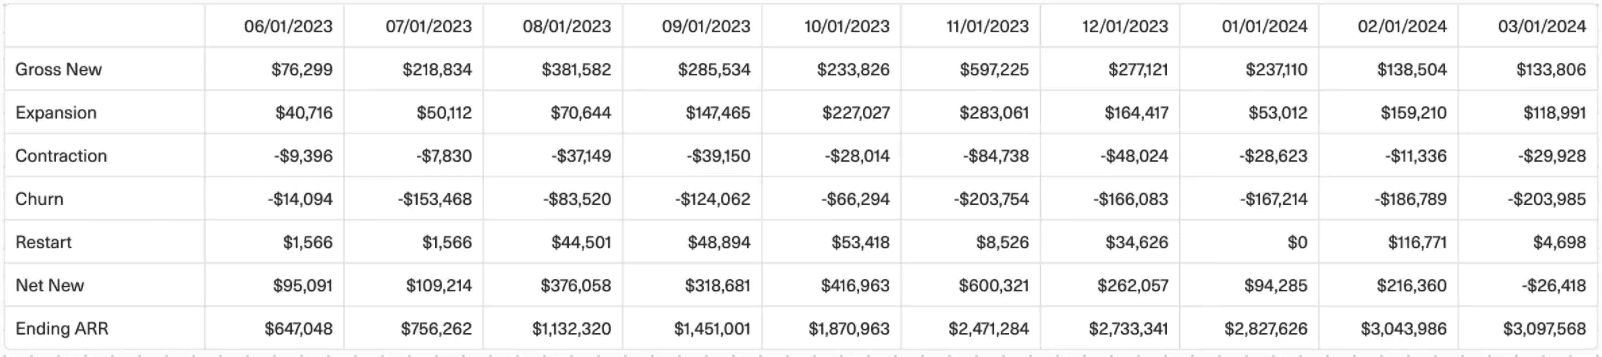
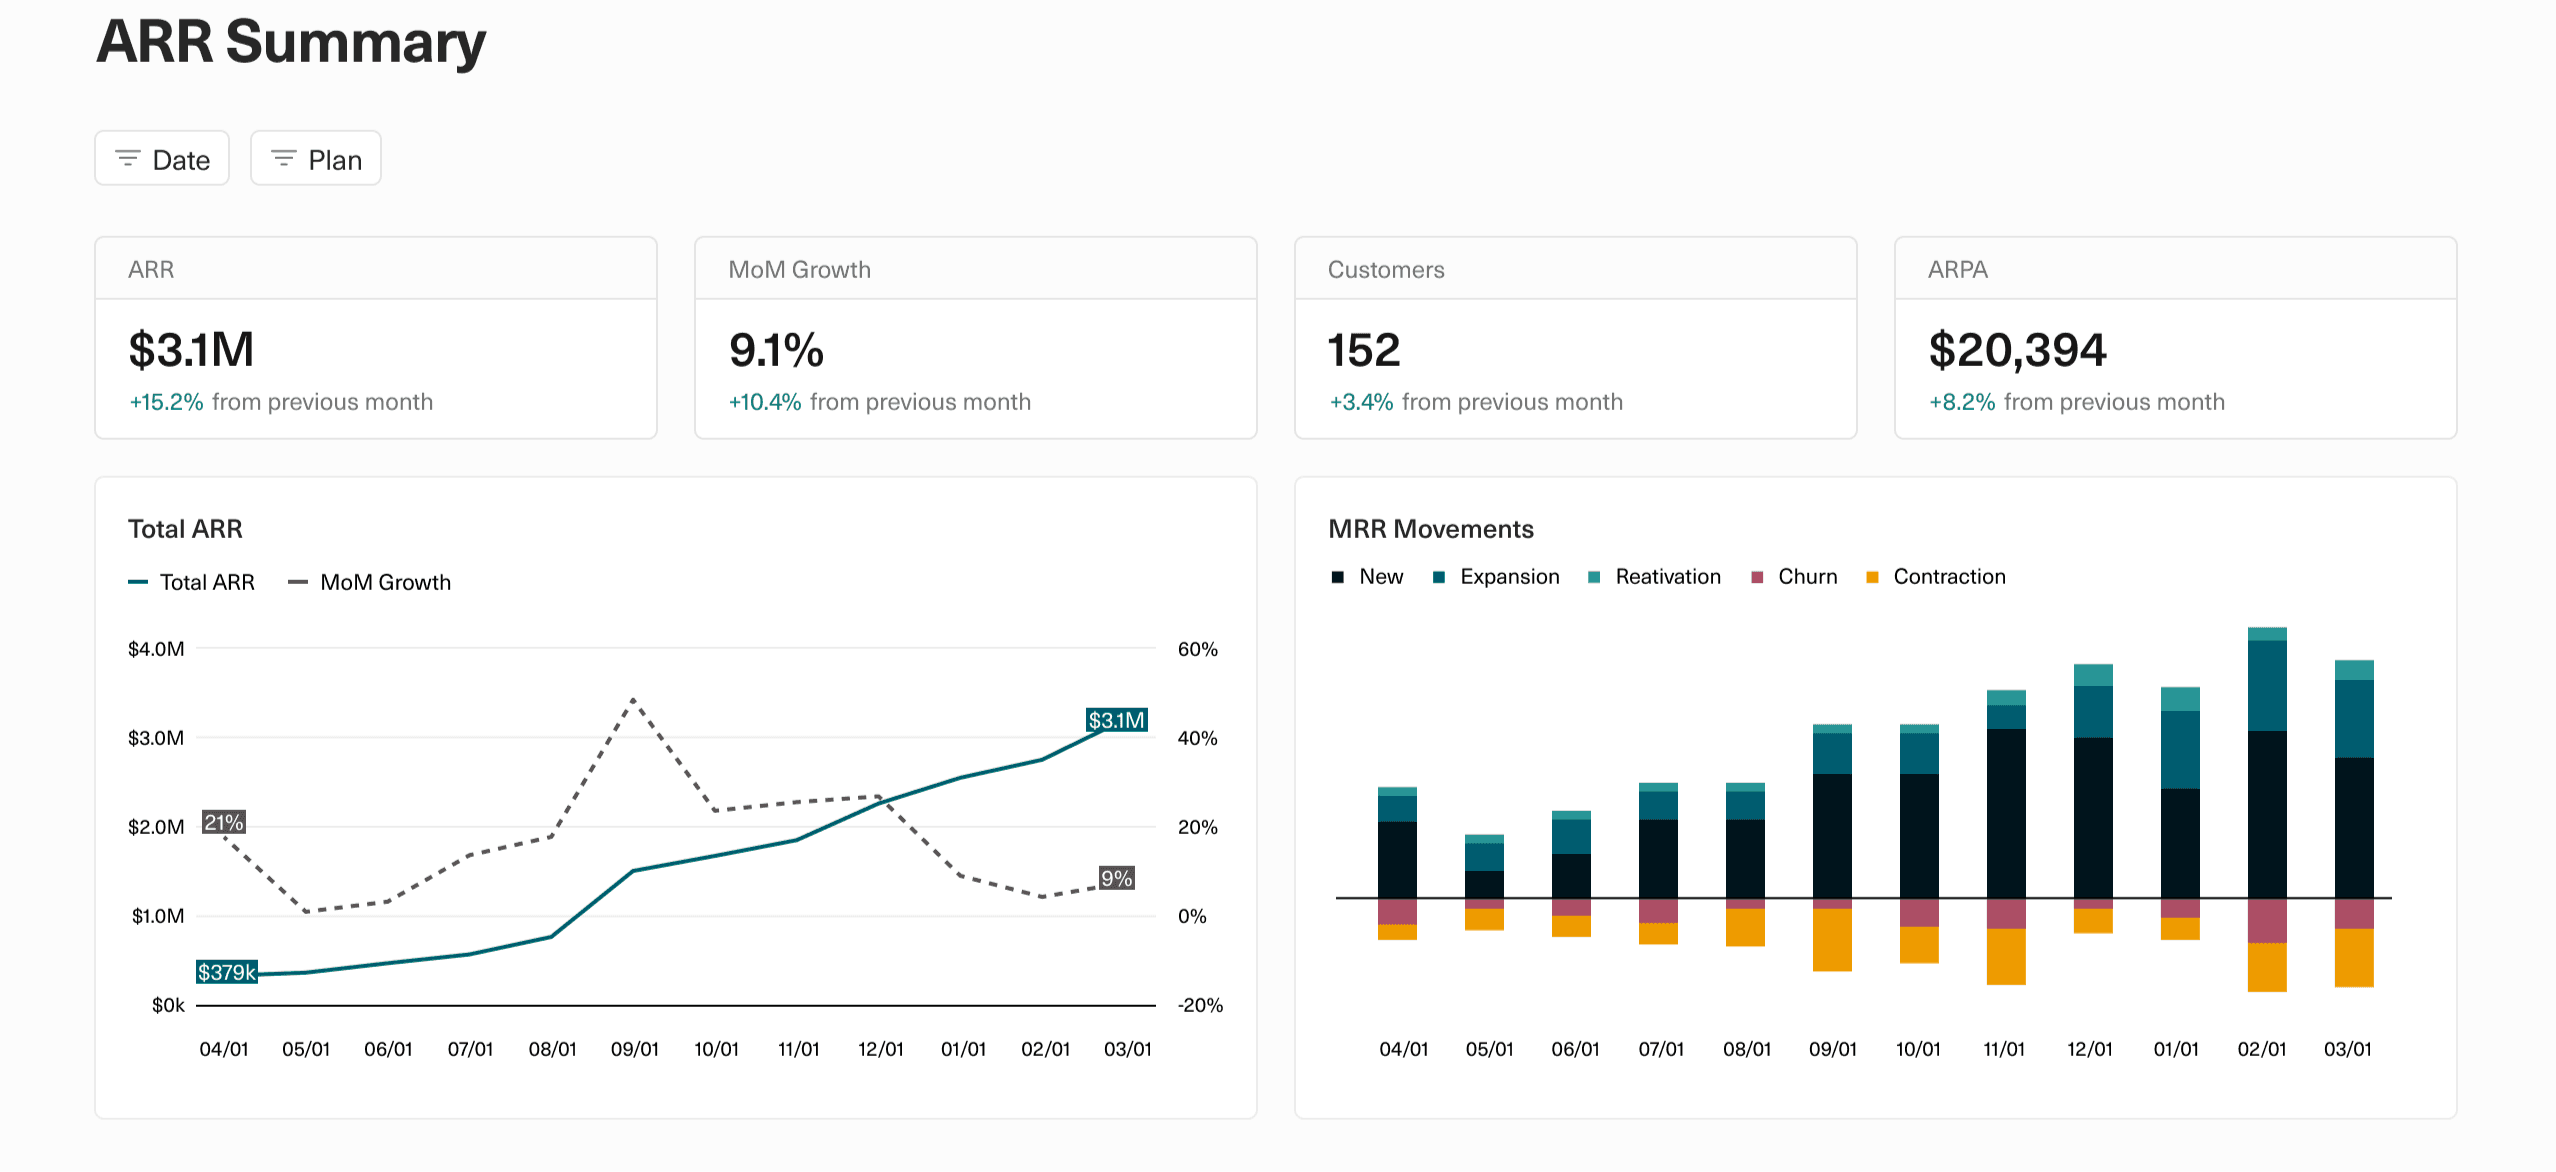
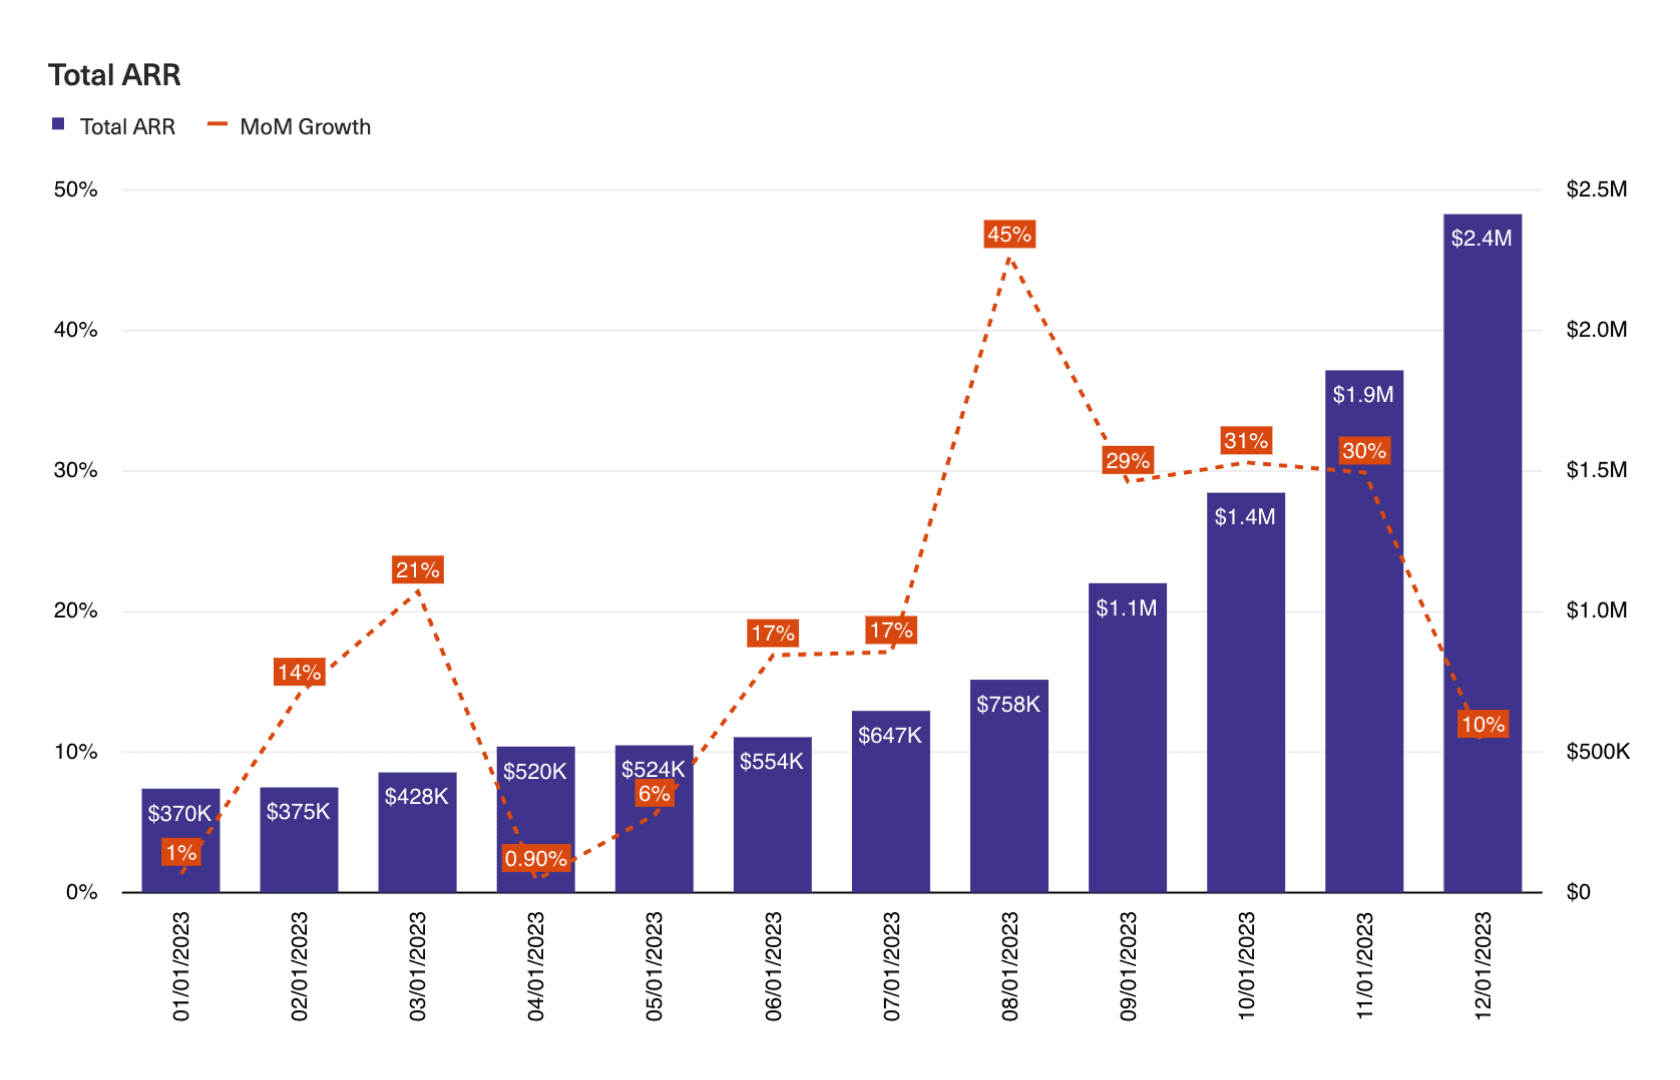
ARR & MRR
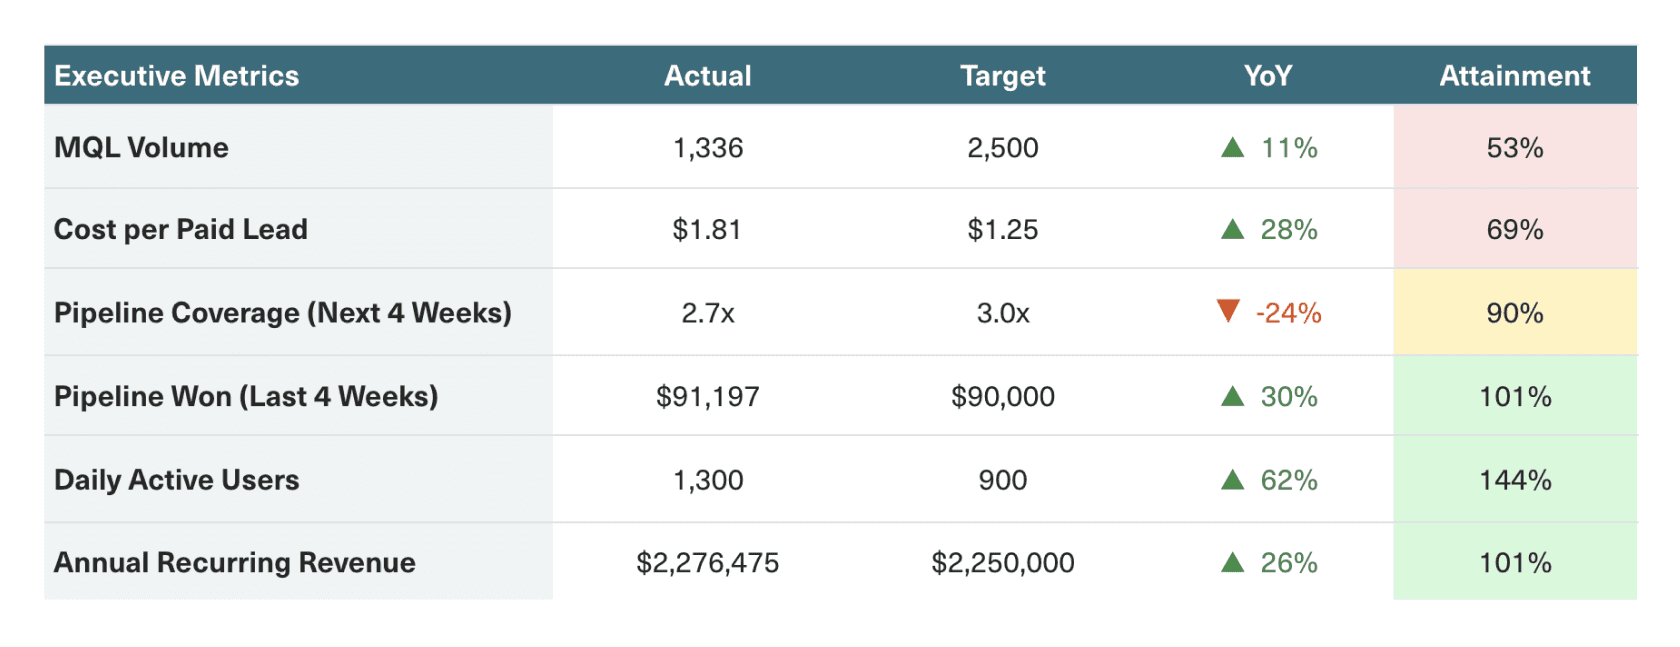
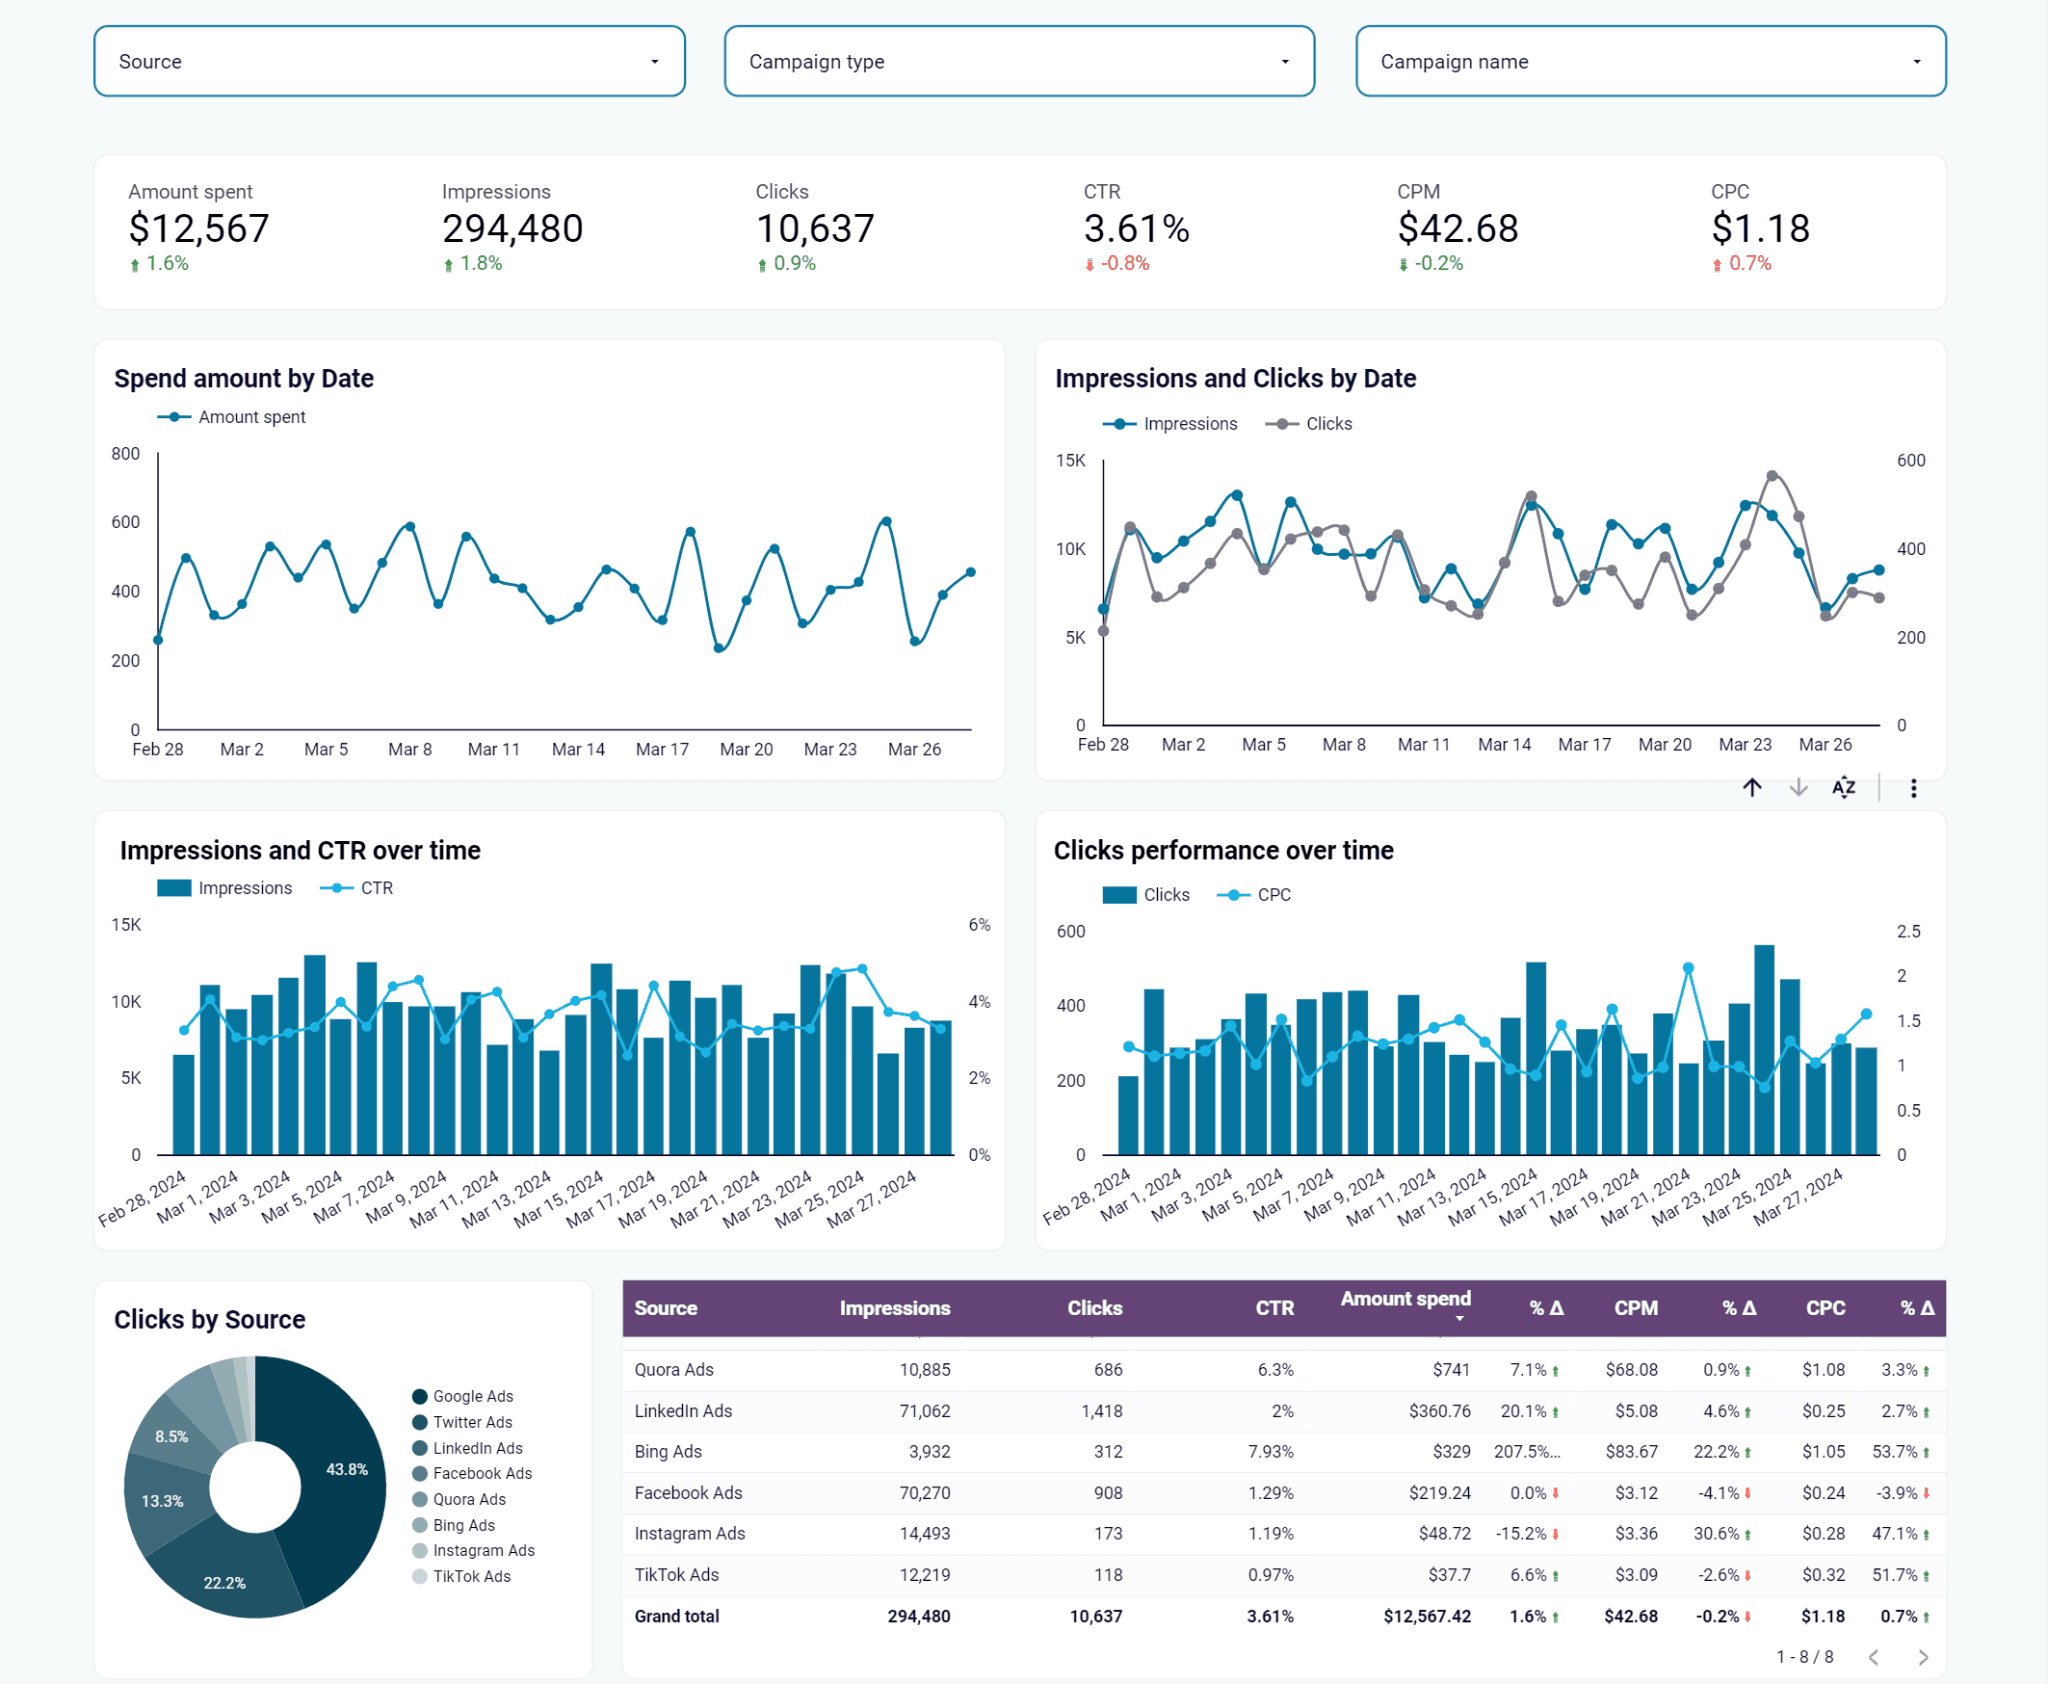
Marketing Performance
Data Pipelines (Automation)
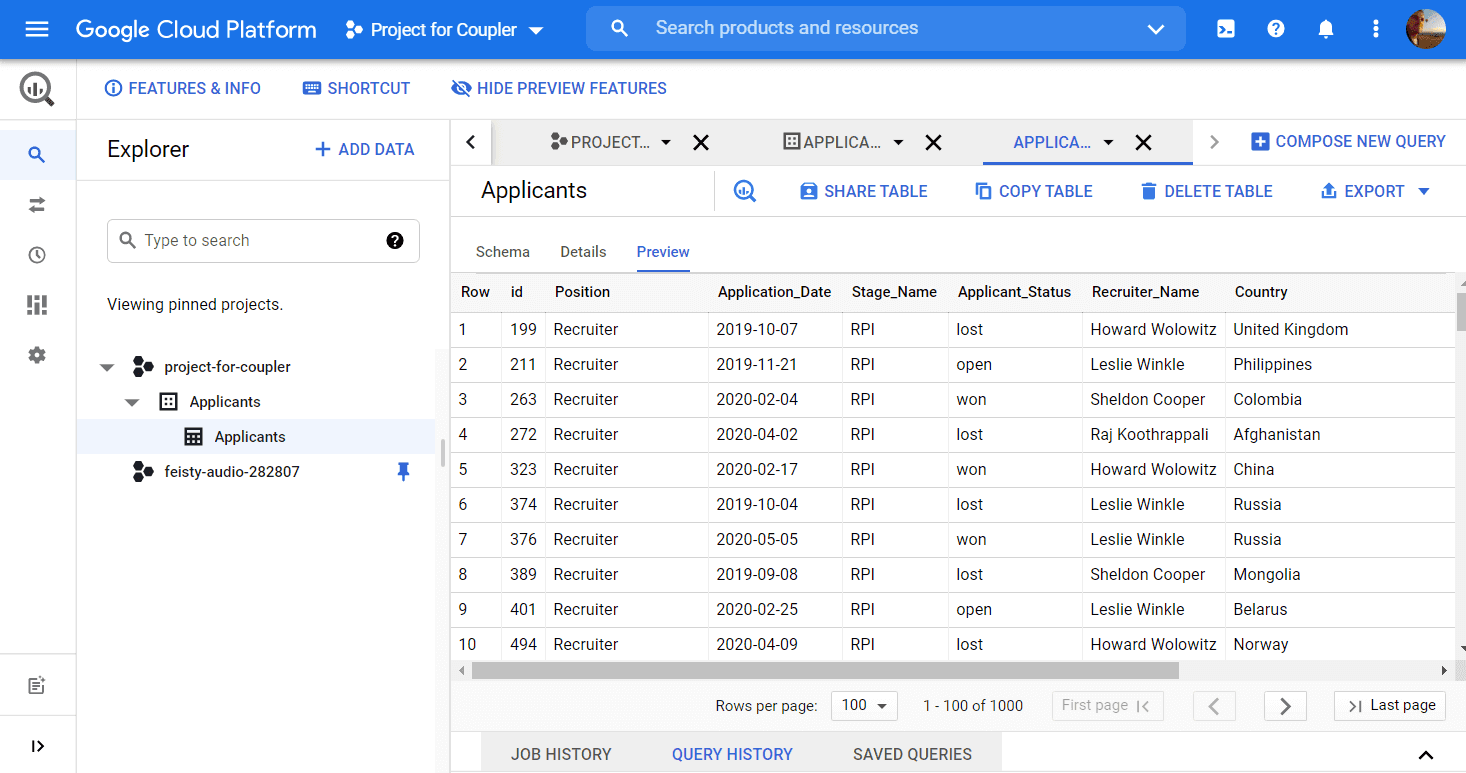
Using SQL and Business Intelligence (BI) tools, I create data pipelines that streamline and automate data workflows. SQL is employed to design and execute queries that extract, transform, and load (ETL) data from various sources into a centralized database.
BI tools then leverage this structured data to build automated reports and dashboards that update in real-time or on a scheduled basis. This integration of SQL and BI tools ensures a seamless flow of accurate, up-to-date information, enabling efficient data analysis and reducing manual data handling. By automating these processes, I enhance data accessibility, improve decision-making speed, and optimize operational efficiency.
Spreadsheets
I use spreadsheets for quick ad-hoc analysis by leveraging their flexibility to swiftly organize, manipulate, and visualize data. With built-in functions and formulas, I can quickly perform calculations, generate pivot tables, and create charts to uncover insights and trends.
This allows for rapid responses to business questions and enables dynamic scenario analysis, making it easier to adapt to changing needs and make data-driven decisions on the fly.